Recently, I am using DMX to construct a knowledge graph related to wine. After practical application during this period, I put forward some suggestions for improvement:
When a user searches for an existing topic or clicks on a selected topic in the right sidebar, the map realistic area should automatically locate the topic and automatically locate the topic in the center of the display screen; when a selected topic is selected, the system automatically displays only other topics directly related to this topic, automatically hides other topics that are not directly related to it. Otherwise, when there are too many topics, it is difficult for users to find the topic they need.
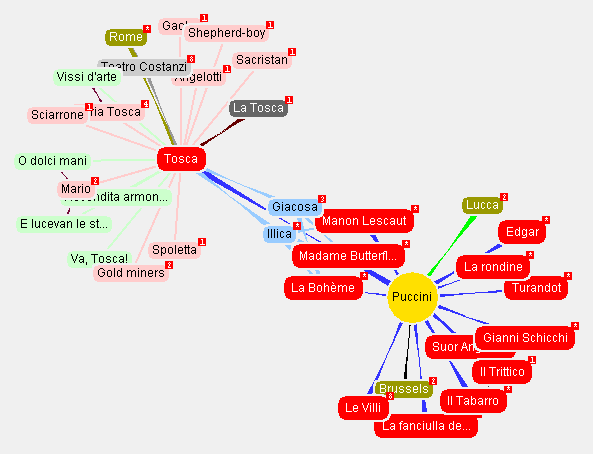
This function can refer to the display mode of Vizigator in Ontopia Toolkit developed by Norwegians, as shown in the attached figure.
Add the function of data export.
Adding several display interfaces, users can choose their favorite display style according to their preferences.
Adding multilingual options, such as China users, can choose the Chinese display interface.
The above suggestions are for reference only. Thank you!
When a user searches for an existing topic or clicks on a selected topic in the right sidebar, the map realistic area should automatically locate the topic and automatically locate the topic in the center of the display screen; when a selected topic is selected, the system automatically displays only other topics directly related to this topic, automatically hides other topics that are not directly related to it. Otherwise, when there are too many topics, it is difficult for users to find the topic they need.
This function can refer to the display mode of Vizigator in Ontopia Toolkit developed by Norwegians, as shown in the attached figure.
The interaction design of the DMX Webclient is deliberately based on different principles than e.g. Ontopia Vizigator or TheBrain. While the latter focus on automatic graph layout and adjustment, the DMX Webclient focuses on both, user created layouts, and stable on screen representations of long term working contexts.
With tools like Ontopia Vizigator or TheBrain with every click the user experiences a dramatic screen change. What is visible on screen, and where, changes dramatically. These changes are not governed by the user but by algorithms. This results in unstable node neighborhoods. The node positions actually have no meaning to the user. The user can’t make use of its spatial sense to orient herself over the course of time. The only thing she gets is snapshots, but not a representation of the higher long term working context as a whole, e.g. when writing an article, a thesis, or a book.
Contrast this with your laptop’s desktop where you organize files/folder spatially. This layout is not auto-generated but generated by you, and it has a meaning to you. You will orient yourself because you can make use of your spatial sense. Only then a mental map is created, that is a consistent space, and a notion of place/location. Only then you’ll remember where things are located.
With the DMX Webclient the screen layout is actively managed by the user, not by intransparent algorithms. On-screen node neighborhoods are stable. That is when you add a node to a map, or select one, all visible nodes stay where they are. Thus a consistent space is created, in which the user can mentally locate herself. Bigger endeavors like e.g. writing an article, a thesis, or a book, are experienced as stable screen representation which preserves the user’s mental model. The on screen map becomes your cognitive habitat.
Using the DMX Webclient the user decides what to see, and where, and what not to see. Note that in DMX what is in the DB is completely independent of what is on screen. There is an explicit show-this-on-that-map command. And there is the crucial difference between the Hide and the Delete command. The entire layout is user generated. When a map is no longer useful in a particular working context it’s up to the user to decide how to rearrange it, or to split it in several maps. The DMX Webclient gives her the freedom to do that. This is how DMX solves the problems of overcrowded maps.
Allow me a question: it seems you’re using both, Ontopia Vizigator, and DMX. What do you like about the former, what about the latter? Do you think a single tool could serve both needs?
Add the function of data export.
What is your intended workflow? What do you actually want to do with the exported data?
Data export is a feature which could be developed by a 3rd party by the means of the DMX Plugin Development Framework. Start here: Develop a DMX plugin.
Adding several display interfaces, users can choose their favorite display style according to their preferences.
By “display style” do you mean something like a “theme”, that is basically a color scheme, or do you mean several map visualization/layout/interaction methods? In case of the latter the DMX Webclient allows 3rd party developers to develop different Topicmap Types. (The DMX standard distro comes with 2 Topicmap Types: the standard map, and the geomap.) If you need info about how to develop a Topicmap Type please let me know.
Adding multilingual options, such as China users, can choose the Chinese display interface.
jri,Thank you very much for your patience in answering this question. I learned a lot of new unknown knowledge. I have used many open source Topic MAps software before, such as tm4j, ontopia, ZTM, Topincs and so on. Of course, it also includes the deepamehta you developed. But because Ontopia has not been updated since it developed to version 5.30 in the past few years, Topincs has been converted to commercial version, Depamehta has been continuously developing and updating, so I only use DMX now.
2.I hope that the purpose of output data is to apply the topic map data I built to other business management systems.
3.I mean the layout of the page and the display of the content.
4.Thank you. I’m just suggesting. It’s not necessarily appropriate.
I think it’s the case that some users of theBrain, e.g. Jerry Michalski (search for “Jerry’s Brain”) deliberately use position for specific reasons. For example, a topic map has topics, associations, and occurrences.
Jerry puts occurrences in columns below the central topic, and puts associated topics along the right side, and “super classes” above…